The body mass index (BMI), or Quetelet index, is a measure of relative size based on the mass and height of an individual.
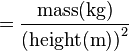
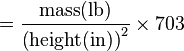
The index was devised by Adolphe Quetelet during the course of developing what he called "social physics", between 1830 and 1850.[1]The BMI for a person is defined as their body mass divided by the square of their height—with the value universally being given in units of kg/m2. So if the weight is in kilograms and the height in metres, the result is immediate, if pounds and inches are used, a conversion factor of 703 (kg/m2)/(lb/in2) must be applied.

The BMI of an individual may also be determined using a table[note 1] or chart which displays BMI as a function of mass and height using contour lines or colors for different BMI categories, and may use two different units of measurement.[note 2]
There are a wide variety of contexts where the BMI of an individual can be used as a simple method to assess how much the recorded body weight departs from what is healthy or desirable for a person of that height. There is, however, some debate about which values on the BMI scale the thresholds for 'underweight', 'overweight' and 'obese' should be set.
| | | |
| |
Categories[edit]
A frequent use of the BMI is to assess how much an individual's body weight departs from what is normal or desirable for a person of his or her height. The weight excess or deficiency may, in part, be accounted for by body fat (adipose tissue) although other factors such as muscularity also affect BMI significantly (see discussion below and overweight). The WHOregards a BMI of less than 18.5 as underweight and may indicatemalnutrition, an eating disorder, or other health problems, while a BMI greater than 25 is considered overweight and above 30 is consideredobese.[2] These ranges of BMI values are valid only as statistical categories
Category BMI range – kg/m2 BMI Prime Very severely underweight less than 15 less than 0.60 Severely underweight from 15.0 to 16.0 from 0.60 to 0.64 Underweight from 16.0 to 18.5 from 0.64 to 0.74 Normal (healthy weight) from 18.5 to 25 from 0.74 to 1.0 Overweight from 25 to 30 from 1.0 to 1.2 Obese Class I (Moderately obese) from 30 to 35 from 1.2 to 1.4 Obese Class II (Severely obese) from 35 to 40 from 1.4 to 1.6 Obese Class III (Very severely obese) over 40 over 1.6
BMI in Children (aged 2 to 20)[edit]
BMI is used differently forchildren. It is calculated in the same way as for adults, but then compared to typical values for other children of the same age. Instead of comparison against fixed thresholds for underweight and overweight, the BMI is compared against the percentilefor children of the same gender and age.[13]
A BMI that is less than the 5th percentile is considered underweight and above the 95th percentile is considered obese. Children with a BMI between the 85th and 95th percentile are considered to be overweight.
Recent studies in Britain have indicated that females between the ages 12 and 16 have a higher BMI than males of the same age by 1.0 kg/m2on average.[14]

Hong Kong[edit]
Category BMI range – kg/m2 Underweight < 18.5 Normal Range 18.5 - 22.9 Overweight - At Risk 23.0 - 24.9 Overweight - Moderately Obese 25.0 - 29.9 Overweight - Severely Obese ≥ 30.0
Japan[edit]
Japan Society for the Study of Obesity (2000):[16]
Category BMI range – kg/m2 Low 18.5 and below Normal from 18.5 to 25.0 (Standard weight is 22) Obese (Level 1) from 25.0 to 30.0 Obese (Level 2) from 30.0 to 35.0 Obese (Level 3) from 35.0 to 40.0 Obese (Level 4) 40.0 and above
Singapore[edit]
In Singapore, the BMI cut-off figures were revised in 2005, motivated by studies showing that many Asian populations, including Singaporeans, have higher proportion of body fat and increased risk for cardiovascular diseases and diabetes mellitus, compared with Caucasians at the same BMI. The BMI cut-offs are presented with an emphasis on health risk rather than weight.[18]
| BMI range – kg/m2 | Health Risk |
|---|---|
| 27.5 and above | High risk of developing heart disease, high blood pressure, stroke, diabetes |
| 23.0 to 27.4 | Moderate risk of developing heart disease, high blood pressure, stroke, diabetes |
| 18.5 to 22.9 | Low Risk (healthy range) |
| 18.4 and below | Risk of developing problems such as nutritional deficiency and osteoporosis |